AIM RESEARCH / STEAM REVIEWS
What 65 AI-assisted Steam games can tell us about reviews and sales
AIM checked the reviews on its released Steam picks. For 42 of the 49 paid games, fewer than ten reviews came from the Steam-purchase filter. Here is why that matters when you try to turn reviews into sales.
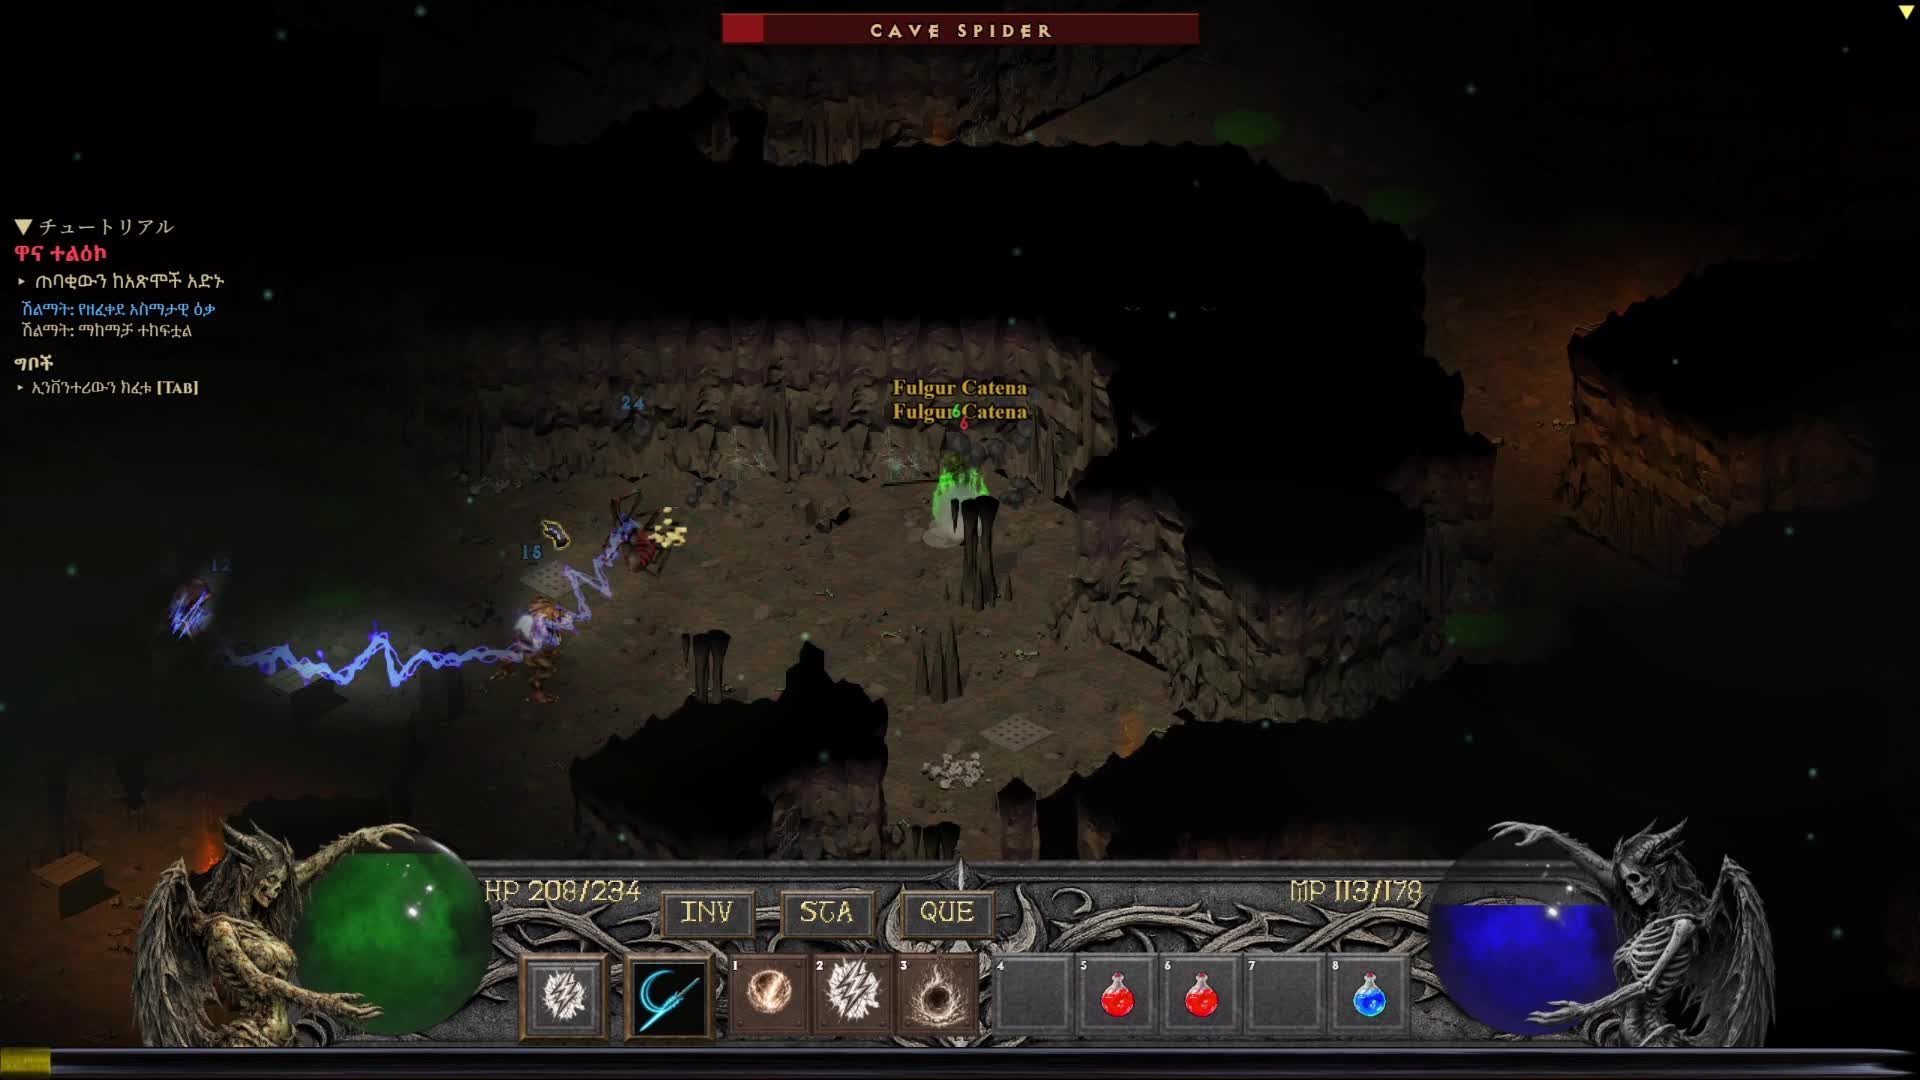
Fire Field had 43 Steam reviews when I checked it on 9 November. A second query for the same game returned 24. Both numbers came from Valve. The first counted reviews across all ways of getting the game. The second used Valve's Steam-purchase filter. Put 43 into a sales calculator instead of 24 and, with everything else held fixed, your result is about 79% higher. The difference comes from changing that one input.
I wanted to see how often that choice matters for the games I've covered as the AI Made Games Steam curator. I also wanted to know which parts of their commercial story I could check from the outside. The review data answered the first question. For the second, a developer's own sales report was more useful than a number on a calculator.
What showed up in the curator's catalogue
I started from a fixed snapshot of 217 AIM recommendations taken on 7 November. I matched their Steam App IDs to base-game store records and kept 65 released games with evidence of substantial AI use in production. Released Early Access games count here. Demos, standalone playtests, and upcoming base games do not. Of the 65, 49 had a paid base game and 16 had a free base game. The store records were captured on 7–9 November; all review counts below are from 9 November.
| Reviews | Paid: all | Paid: Steam | Free: all |
|---|---|---|---|
| 0 | 17 | 21 | 1 |
| 1–9 | 23 | 21 | 7 |
| 10–99 | 8 | 7 | 7 |
| 100 or more | 1 | 0 | 1 |
| Games in each group | 49 | 49 | 16 |
“All” includes all acquisition sources. “Steam” uses Valve’s Steam-purchase filter.
The two paid columns describe the same games. Changing the filter moved seven games to a different row. The median dropped from two reviews to one, and 19 of the 49 games had different totals. The free games have their own column because an install or a review for a free base game cannot tell you what the studio earned from in-game sales or other products.
There are useful differences between individual games. CODEX MORTIS had 110 reviews across all sources and 97 in the Steam-purchase filter. In Your Hands had six in both. Double Skunk had zero in both at the time of the check, five calendar days after the date shown on its Early Access store page. Zero reviews tells us that no qualifying review was counted at that time. It leaves sales unknown.
What an actual sales disclosure adds
Outside the AIM sample, the developer of Pixel Darts: From Pub to Glory posted a 29 September update, roughly ten weeks after launch. They reported 202 copies sold, $1,165 in gross Steam revenue, and 19 reviews. The game discloses AI use in its code, audio and visuals. The developer also reported spending about $600 on software and AI tools and putting about 1,000 hours into the project. That makes the gross figure more useful: you can see the difference between the money recorded on Steam and what the work cost the developer. The update does not specify a purchase filter for its review count. Developer's report.
The small puzzle game Prickle offers a separate example. Its studio reported about 500 copies sold and 55 reviews after two weeks. The two reports put sales per reported review around 11 and 9, respectively. Their observation periods and review filters are not matched. Treat those ratios as descriptions of two reports, not a number to apply to the 49 paid games. Valve's reporting guide also distinguishes gross revenue, adjustments such as refunds and taxes, and what the studio is paid.
How I would use a review calculator
Start by recording the source, filter and date. If the model was built on reviews from Steam purchasers, feed it the same filter. Then show what happens when the sales multiplier changes. For a fictional game with ten such reviews, multipliers of 10, 30 and 60 give 100, 300 and 600 hypothetical copies. At a hypothetical average of $5 per copy, those are $500, $1,500 and $3,000 in gross sales scenarios. None is a minimum, a maximum, or a forecast. The actual average price depends on what people paid, including discounts and regional prices; the US list price is only one price a buyer may see.
For a specific small game I'd publish the dated review count and look for an actual developer disclosure before attaching a dollar figure. Twenty-one paid picks had no reviews in the Steam-purchase filter. Any simple multiplier would give them all the same answer, even though their real outcomes could be quite different.
How I checked
I used Valve's public GetAppReviews endpoint and requested lifetime positive and negative review counts in all languages. The first pass used all acquisition sources for all 65 releases; the second used the Steam-purchase filter for each of the 49 paid games. Both passed the same off-topic-activity filter. The Steam-purchase number is an acquisition filter, not a count of full-price or retained purchases. Valve explains which players can review and which reviews enter the store score.
The sample represents picks in AIM's curator catalogue at a fixed date. Games in it have been available for different lengths of time. It cannot tell us how AI-assisted games sell across Steam, or what effect AI had on sales. It can tell us how much context goes missing when one public number stands in for a game's business.